
















Employee Productivity Monitoring: Tools, Metrics & Ethics

Employee productivity monitoring delivers actionable insights only when tied to specific business decisions about work outcomes. Yet monitoring can increase employee stress, with one survey finding 45% higher stress for those under both online and physical monitoring, underscoring the tension between operational visibility and digital micromanagement.
The practical payoff is clearer resource allocation, faster problem resolution, and fairer performance evaluations—but only when the data answers questions managers are prepared to act on.
What should employee productivity monitoring measure?

Employee productivity monitoring should measure evidence of work moving through a process, not signals that merely show someone touching a device. Start with a business problem, choose three to five measures that expose it, and decide in advance what a manager can do if one of them moves.
That rule keeps the exercise grounded. A support leader with an aging queue needs queue age, transfer rate, first-contact resolution, and CSAT.
A manager does not need a universal activity score to decide whether a routing rule is wrong.
Outcome
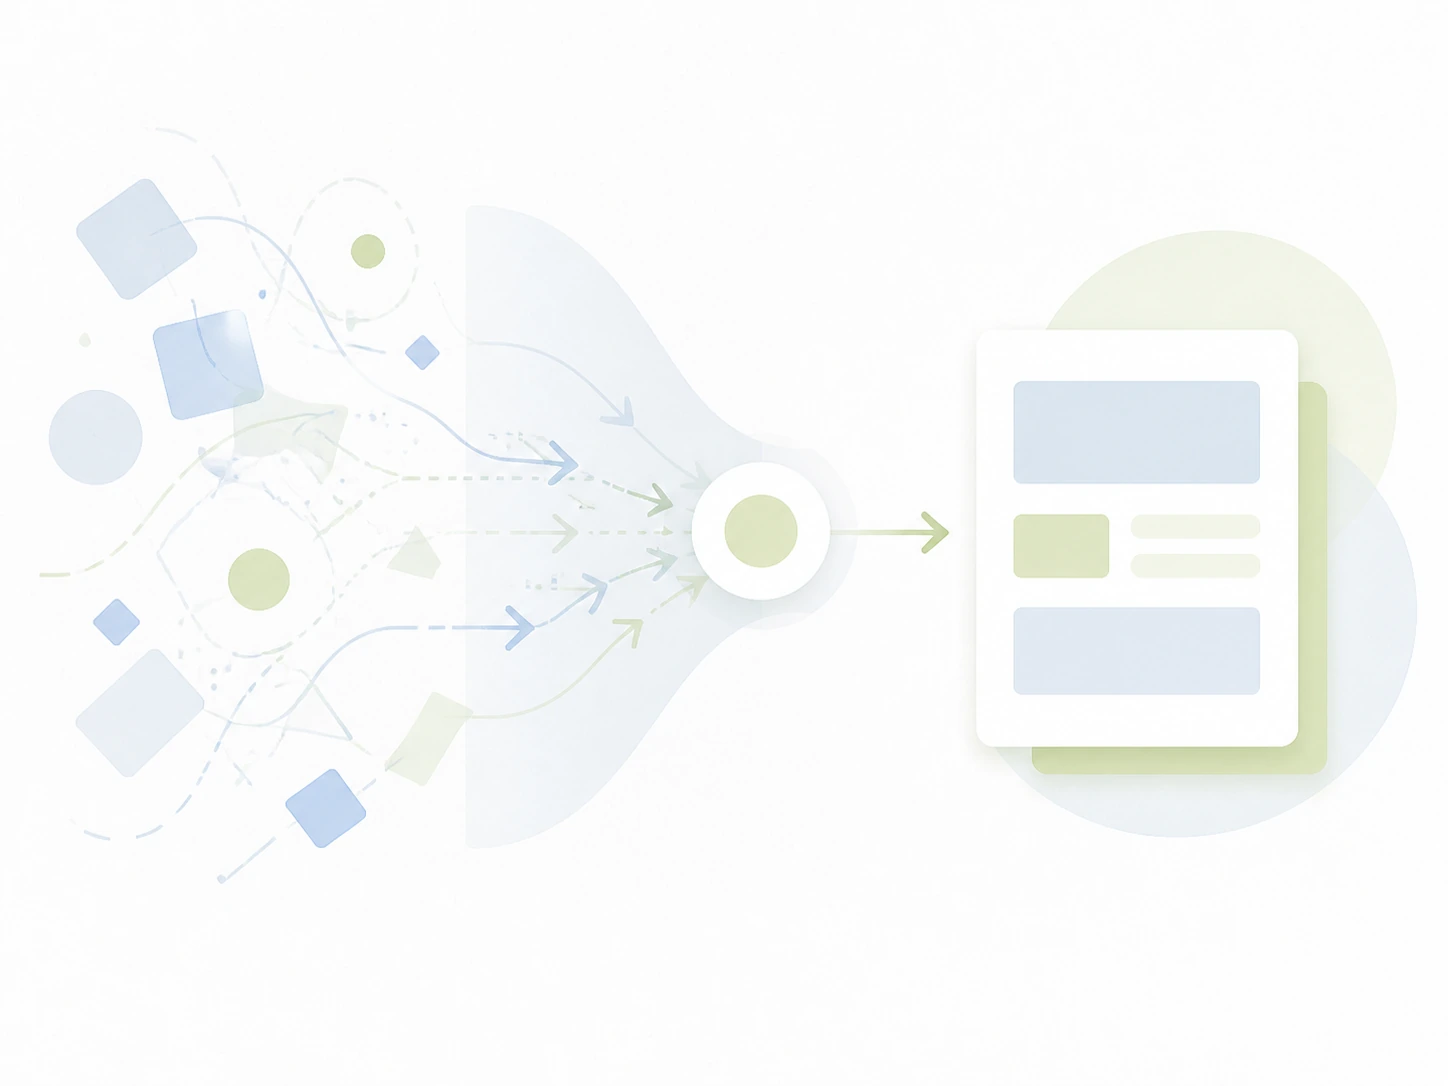
Measure completed or improved work such as resolution time first-contact resolution or deliverable completion.

Constraint
Track the bottleneck that limits flow such as queue age blocked-work age or pipeline stage delay.

Handoff
Measure where work changes owners such as transfer rate review time or handoff age.
Measure work evidence, not busyness
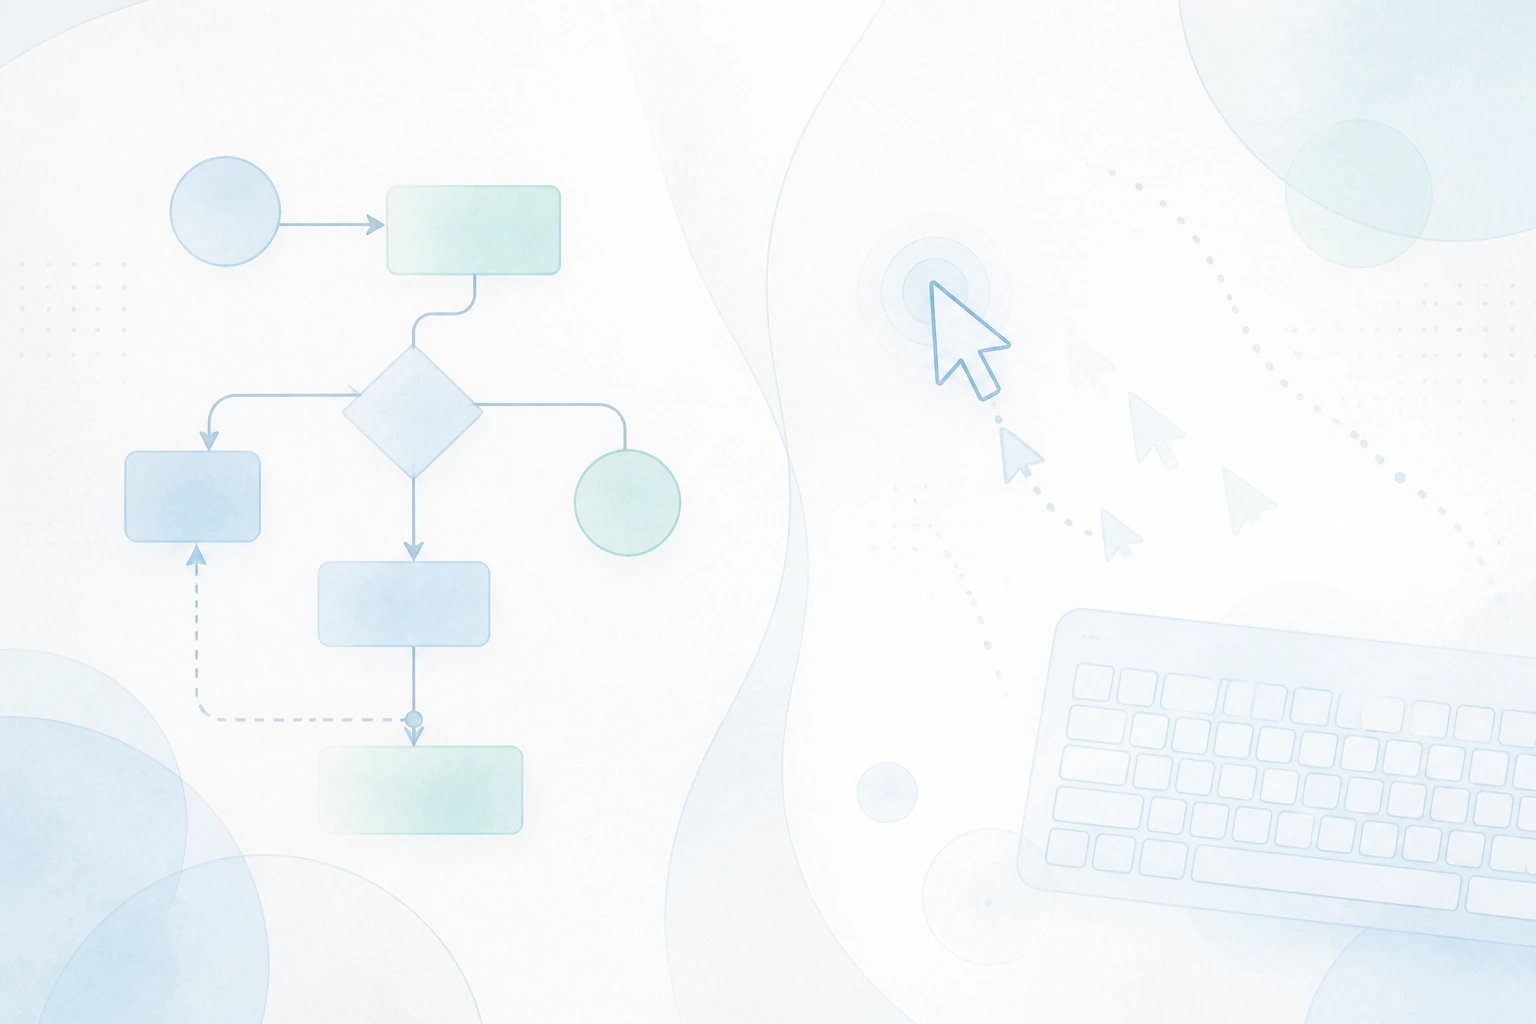
The most useful employee productivity metrics describe an outcome, a constraint, or a handoff.
Resolution time can expose a support bottleneck; pipeline stage age can expose an approval delay; cycle time can expose a development-review queue. A single number is rarely the answer, but a small group of measures can tell a manager where to look next.
The smart approach is to write the decision beside each metric. "If transfer rate rises, inspect routing and knowledge coverage" is useful. "Track activity" is not a decision, and it gives employees no clear explanation of why the data exists.
Together, these measures connect operational evidence to a decision a manager can explain and act on.
Map the problem before buying software

Use the workflow system closest to the work whenever possible. A help desk can often answer a service question; a CRM can answer a follow-up question; a delivery platform can answer a release question. Employee productivity tracking software belongs in the gap between those systems, not on top of them by default.
What do support, sales, development, and remote teams actually monitor?

Different teams create value differently, so their reports should not look identical.

Support: queue health and resolution quality
Support teams can review backlog age, median resolution time, first-contact resolution (FCR), transfer rate, and CSAT. Read the numbers together: a faster resolution time is not an improvement if FCR and CSAT fall at the same time.
For example, a spike in transfers may point to a bad routing field or a missing knowledge-base article. The manager's next step is to sample the transfer reason and correct the process, not to assume that the agent with the most transfers is the problem.
Sales: movement through the pipeline
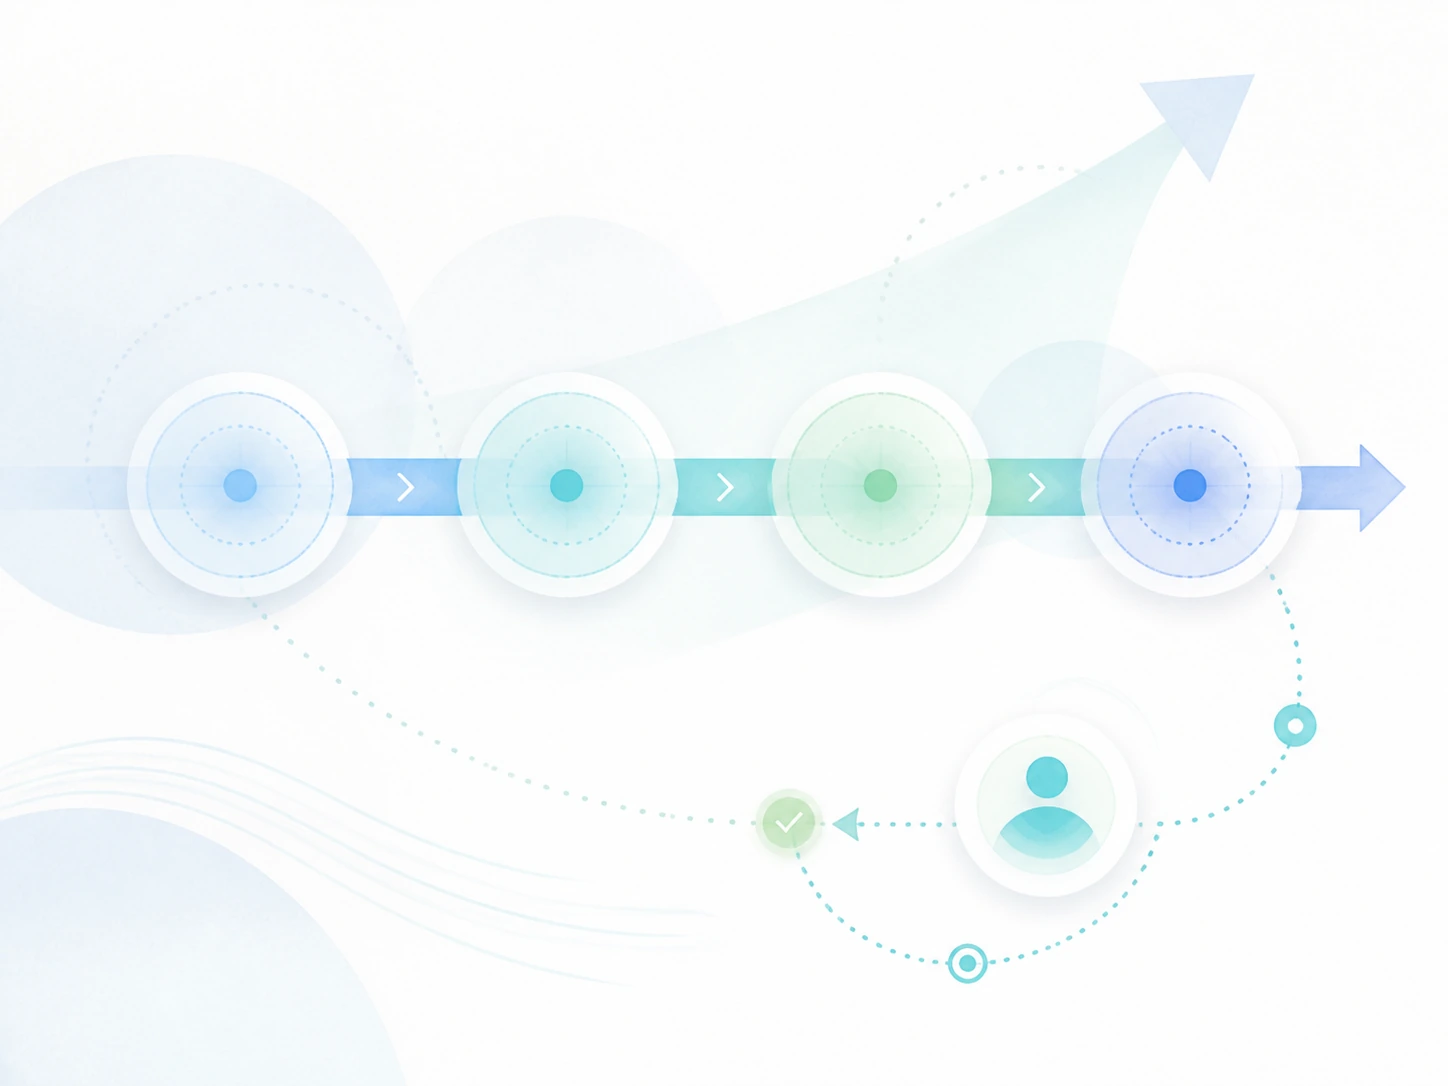
Sales managers need pipeline velocity, stage age, close rate, and follow-up cadence by segment. Compare like with like: enterprise accounts can have a different normal cycle from smaller inbound deals.
If pipeline velocity slows, check whether deals are stalling at a specific stage, then review the sales enablement materials or customer qualification criteria.
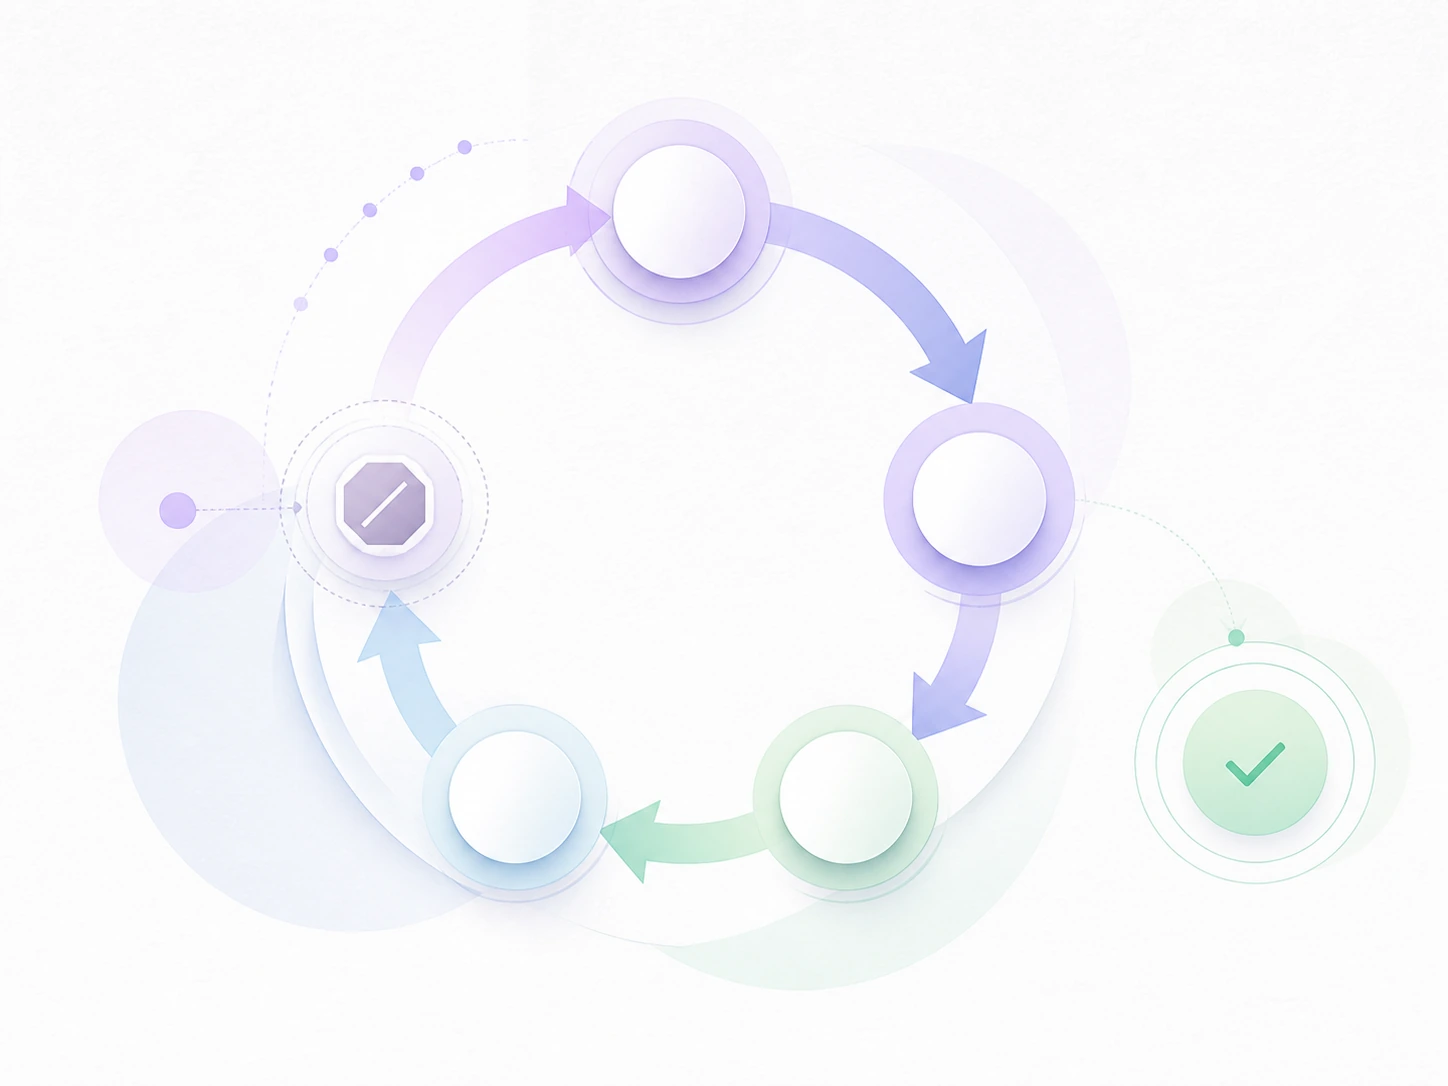
The same principle applies to delivery and distributed work: measure the flow and handoff, not visible activity.
Development: delivery flow and defects
Development teams can use deployment frequency, cycle time, blocked-work age, change failure rate, and defect escape as delivery signals. Compare the team with its own baseline and account for release windows, incidents, and architecture changes.
If cycle time increases, examine whether code reviews or testing are creating bottlenecks, then adjust team capacity or process steps.

Remote teams: handoffs and deliverables
For remote teams, employee productivity monitoring should track deliverable completion, blocked-work duration, handoff age, and agreed response expectations for designated work channels. A documented decision and completed handoff often matter more than online presence, especially across time zones.
Once you know what to measure for each role, the next question is which software can capture those signals without unnecessary overhead.
Which employee productivity monitoring software fits the job?
Prices are USD snapshots from the accepted research dated August 22, 2026; confirm live price, billing term, plan limits, product features, taxes, and contract conditions immediately before publication or purchase.
Hoverwatch: authorized company-device oversight
Hoverwatch Business pricing lists a Business plan at $149.95 per month for up to 25 devices, approximately $6 per device at full capacity.
It is a device-level monitoring option for owned or authorized company devices,
not a workforce-analytics product with the same scope as team capacity platforms.
Use it only with a documented business purpose, an authorized device, and notice where required. It fits a defined company-device oversight need, not team capacity or aggregate workflow trends, and is never a case for hidden monitoring, keylogging, webcam surveillance, or reading private messages.
Time Doctor: task-linked time and work-pattern reporting
Time Doctor’s pricing page lists Basic at $6.67 per user per month when billed annually or $8 month to month; Standard at $11.67 annual or $14 monthly; and Premium at $16.70 annual or $20 monthly.
Its plans cover time tracking and may include tasks, screenshots, app/web reports, attendance,
and productivity reporting depending on tier, so verify the selected plan rather than assuming every capability is included.
This is a practical shortlist candidate when a team needs timesheets tied to tasks and a manager needs work-pattern context. Do not choose it when the ticketing, CRM, or delivery system already answers the operational question, or when the organization plans to turn screenshots into a permanent default.
Hubstaff: configurable time tracking for distributed work
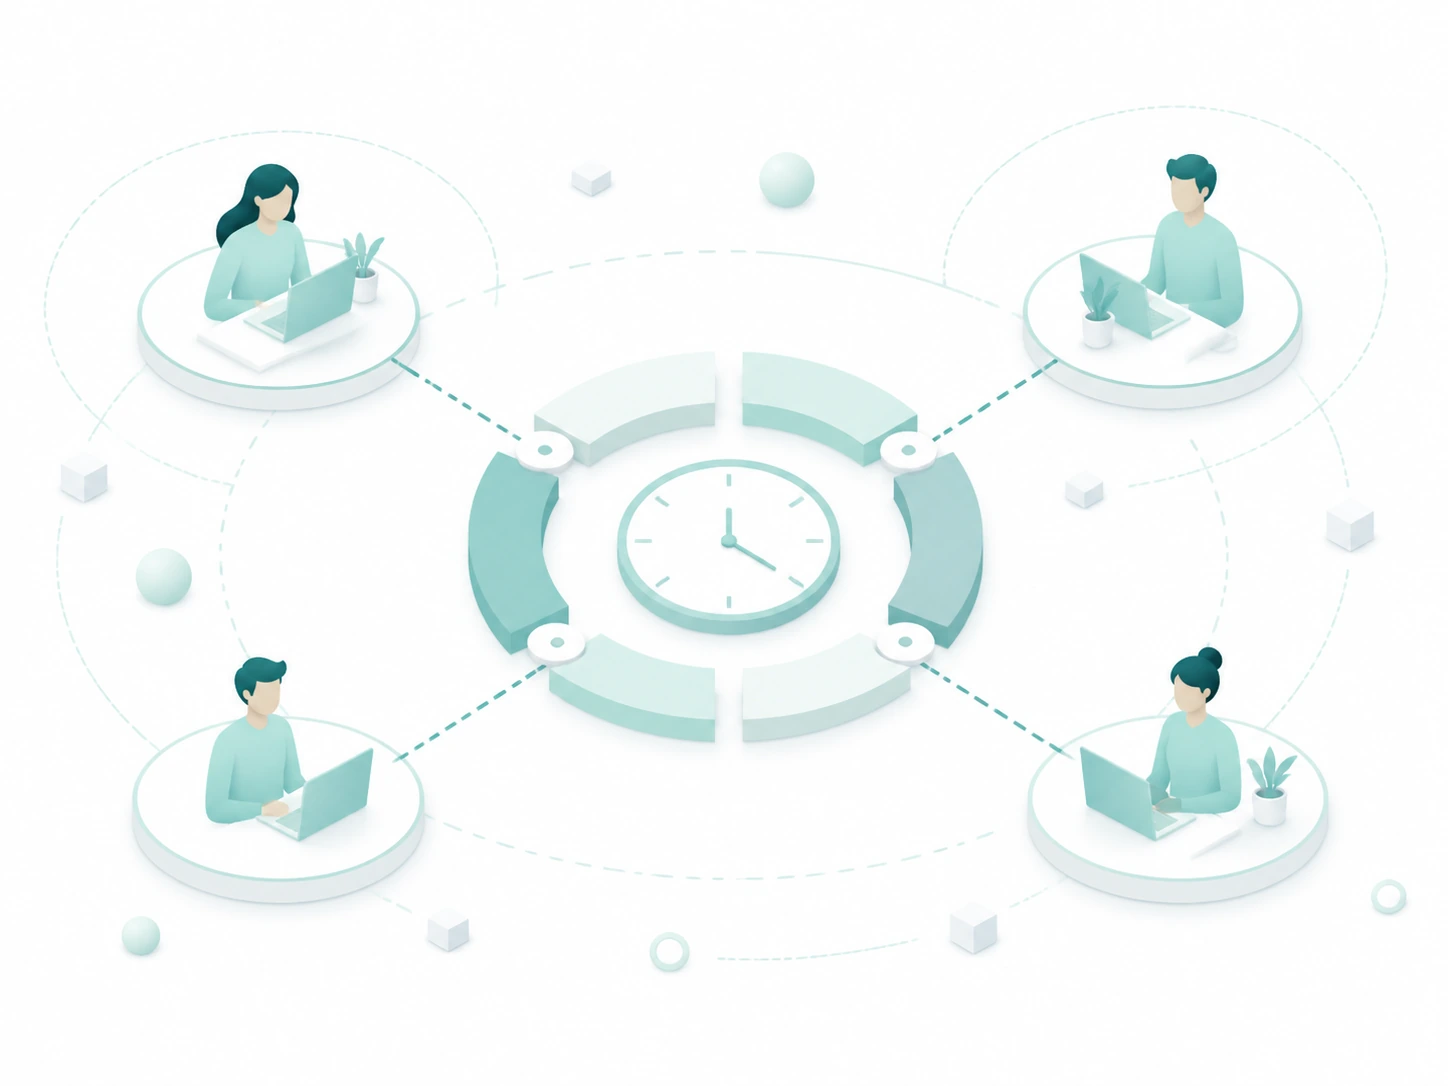
Hubstaff’s pricing page lists Grow at $7.50 per user per month billed annually or $9 monthly, and Team at $10 annually or $12 monthly.
Hubstaff describes time tracking, app/URL tracking, optional screenshots, reports, roles,
and configurable settings; confirm the plan-level availability and current controls before rollout.
Hubstaff can fit a distributed service, project, or field operation that needs time and project visibility. The limitation is management discipline: optional screenshot and activity settings do not make a context-free performance score valid. Start with time and deliverable data, then add collection only for a stated question.
Teramind: security-oriented depth with a governance cost
Teramind’s pricing page lists Starter at $14 per user per month, UAM at $28, and DLP at $32; the Starter snapshot carries a five-seat minimum.
Teramind positions its products around deeper activity monitoring, screen recording,
behavior rules, and security/DLP use cases.
That depth can be appropriate for a documented security, compliance, or insider-risk need with strong governance. It is a poor default for ordinary productivity management because the organization must be able to justify the purpose, limit access, set retention, and explain why less intrusive evidence was insufficient.
ActivTrak: aggregate workforce analytics and capacity trends
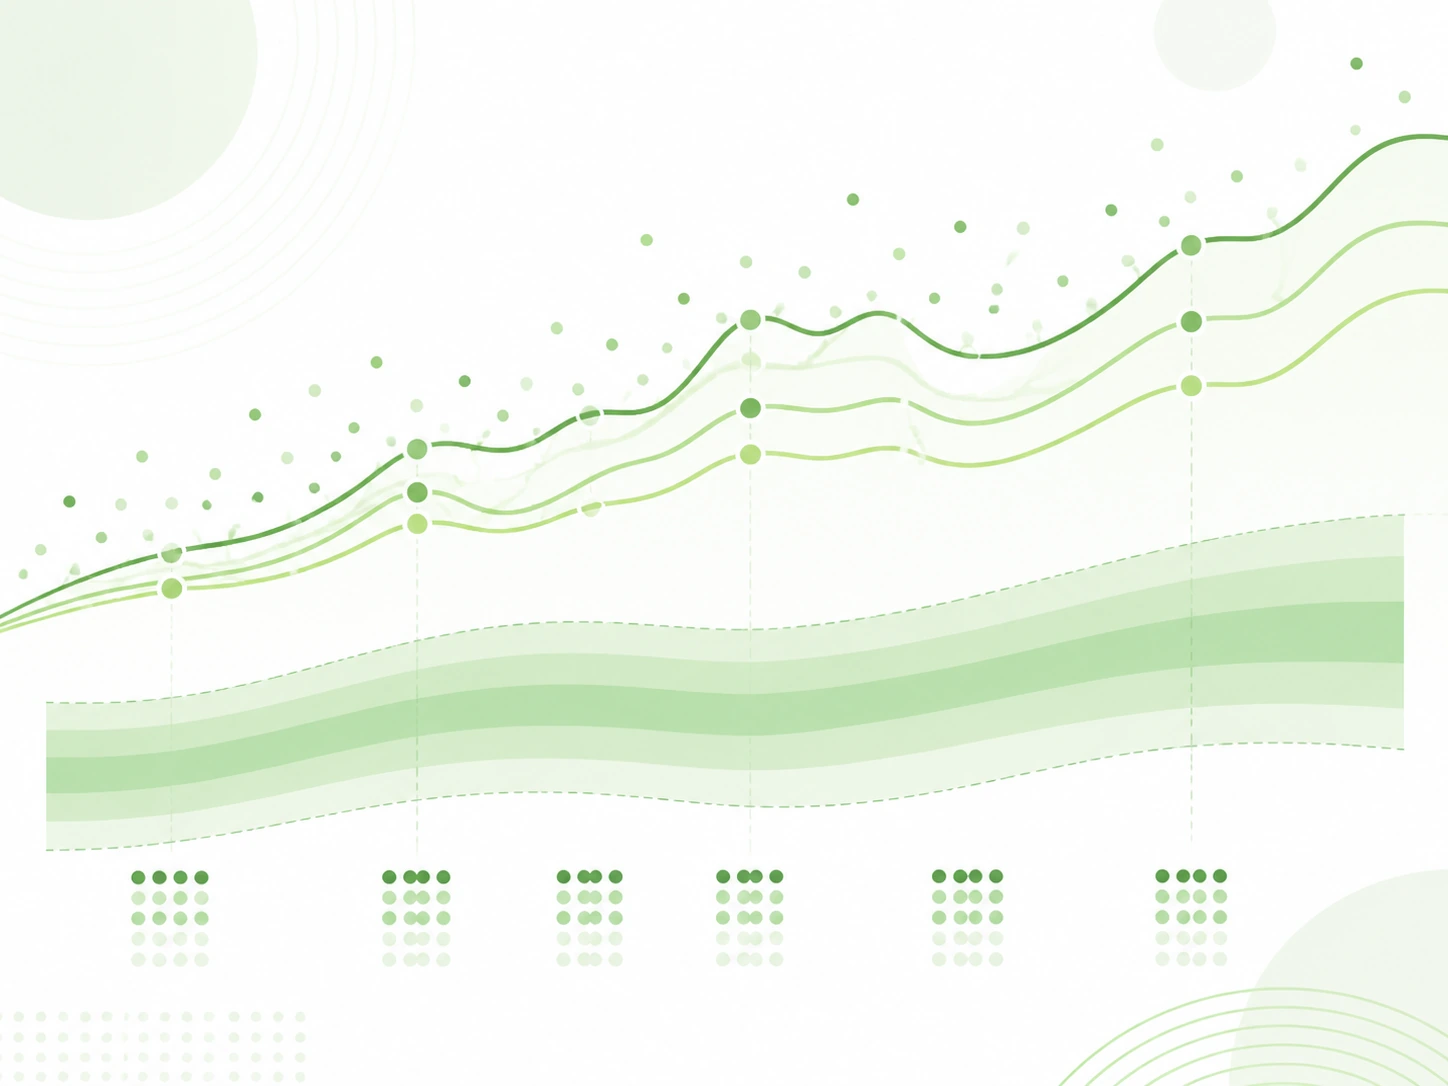
ActivTrak’s pricing page lists Work Activity Tracking at $10, Workforce Management at $15, and Productivity Optimization at $17 per worker per month on annual plans; quote and contract terms may apply.
ActivTrak describes workforce analytics, work trends, and schedule or capacity-oriented visibility
rather than a manager watching a single person's screen.
It is a better fit when the question is where a team has capacity friction or uneven workflow demand. Use aggregation first, restrict drill-down access, and explain the purpose. Do not buy it expecting a dashboard to produce an automatic productivity verdict.
Comparison: price, scope, and privacy controls
| Tool | Price basis, checked Aug. 22, 2026 | Time tracking | App/URL data | Screenshots or recording | Reports and analytics | Privacy controls or limits | Minimum/billing caveat | Best fit |
|---|---|---|---|---|---|---|---|---|
| Hoverwatch | $149.95/month for up to 25 devices | Not positioned as a workforce time system | Device-level scope; verify plan | Verify current plan; never use covertly | Device oversight, not analytics parity | Authorized devices, disclosed purpose, restricted access | Flat 25-device bundle | Defined company-device oversight |
| Time Doctor | $6.67-$16.70 annual or $8-$20 monthly per user | Yes | Yes, by plan | By plan/settings | Tasks, attendance, productivity reports | Configure collection and access | Annual versus monthly; plan features vary | Task-linked time reporting |
| Hubstaff | Grow $7.50/$9; Team $10/$12 per user | Yes | Yes | Optional | Time, project, activity reports | Roles and configurable settings | Annual versus monthly; verify limits | Distributed service or project work |
| Teramind | $14/$28/$32 per user monthly | Verify plan fit | Deep activity data | Screen recording by plan | Behavior and security analytics | Strict purpose, access, and retention controls | Five-seat Starter minimum | Security or DLP program |
| ActivTrak | $10/$15/$17 per worker on annual plans | Plan dependent | Work activity insights | Verify plan/settings | Workforce and capacity trends | Aggregate-first, role-based access | Annual/quote terms may apply | Capacity and workflow analysis |
What vendor customer stories can, and cannot, tell you

Time Doctor publishes a support-BPO story reporting a 25% productivity boost and a healthcare story reporting efficiency from 48% to 86%–89%; ActivTrak publishes case studies reporting customer satisfaction improvements; Teramind publishes case studies reporting significant processing-time reductions.
These are vendor-reported customer outcomes, not independent proof that any tool will cause the same result for another company.
Use these stories as pilot questions, not forecasts.
A vendor case study can suggest where to investigate; it cannot substitute for your own baseline.
How should a manager turn an employee productivity report into action?

A useful employee productivity report has a baseline, a current period, variance, context, and a named next action. The weekly review should take 15 minutes, not an hour of dashboard theater.
Editorial persona: Victoria Bryan is a project-approved fictional expert profile, not an independently verified real person. This guidance was written and fact-checked by the editorial team; it is not a verbatim interview quotation.
Start by checking variance against a four-week baseline for three to five agreed measures. Then note context: staffing, releases, campaign volume, outages, holidays, and changes to definitions. Identify one bottleneck, assign one action and owner, and record what signal should change next week.

An illustrative routing example
This example is illustrative, not a customer result.
A 12-agent support team sees 38% of billing tickets transferred at least once, while other queues sit near a 14% baseline. Staffing and ticket volume are stable, so the manager samples transfer reasons instead of ranking agents.
The review finds that a subscription-change question is being tagged as technical. The next action is clear: Support Operations corrects the routing field, the support lead adds a knowledge-base article, and both review transfer rate and FCR next Friday.
The point is to repair a handoff, not to make agents generate more device activity.
| Metric | Four-week baseline | Current week | Variance | Context note | Next action and owner |
|---|---|---|---|---|---|
| Billing-ticket transfer rate | 14% | 38% | +24 points | New subscription-change form | Support Ops corrects routing by Friday |
| First-contact resolution | 72% | 64% | -8 points | Transfers require a second agent | Support lead publishes article |
| Median resolution time | 7.1 hours | 9.4 hours | +2.3 hours | Volume and staffing stable | Queue manager tests the change |
| CSAT | 91% | 88% | -3 points | Watch after the routing fix | Support lead reviews next week |
Do not turn the table into an individual ranking. A shared pattern calls for a process fix, and a leaderboard can make people hide the context the manager needs to see.
What goes wrong after a monitoring rollout?

Most rollout failures are predictable: employees do not know what is collected, managers receive more data than they can use, or the organization never acts on the reports. A pilot should solve one of those problems before it expands scope.
The fix is often a process change, not more data collection—as shown in the routing example in the previous section.

Low trust: explain the boundary before collection
Publish a plain-language notice that states the purpose, devices and data types in scope, who can access the data, retention period, exclusions, and escalation path. Give employees a way to see their own information and explain what the program will not do: no secret monitoring, no webcam surveillance, and no automatic discipline from an unexplained score.
Transparency is not just a legal formality. It lets people understand the management question and challenge missing context before a bad interpretation becomes a management decision.

Data overload: keep only decision-linked measures
For every field, name the decision and the person who can make it. If a manager cannot describe the action a metric could trigger, remove it from the report. This is often where a smaller workforce analytics software rollout becomes more useful than an elaborate collection program.
The goal is not to make every work signal visible. It is to make the few signals that reveal a bottleneck visible enough to act on.
No action: use a 90-day pilot and a kill switch
Run a 90-day pilot with a written baseline, purpose, narrow population, review cadence, and success measure.
Review the pilot at 30, 60, and 90 days, and stop or reduce collection if the data creates material trust harm, produces no explainable action, or is more intrusive than the decision requires.
Why do screenshots, keystrokes, and activity scores fail as performance measures?

They fail because they substitute a visible proxy for the work outcome. Screenshots, keystrokes, mouse movement, and idle time can be easy to collect, but they often remove the context that makes a manager’s conclusion fair.
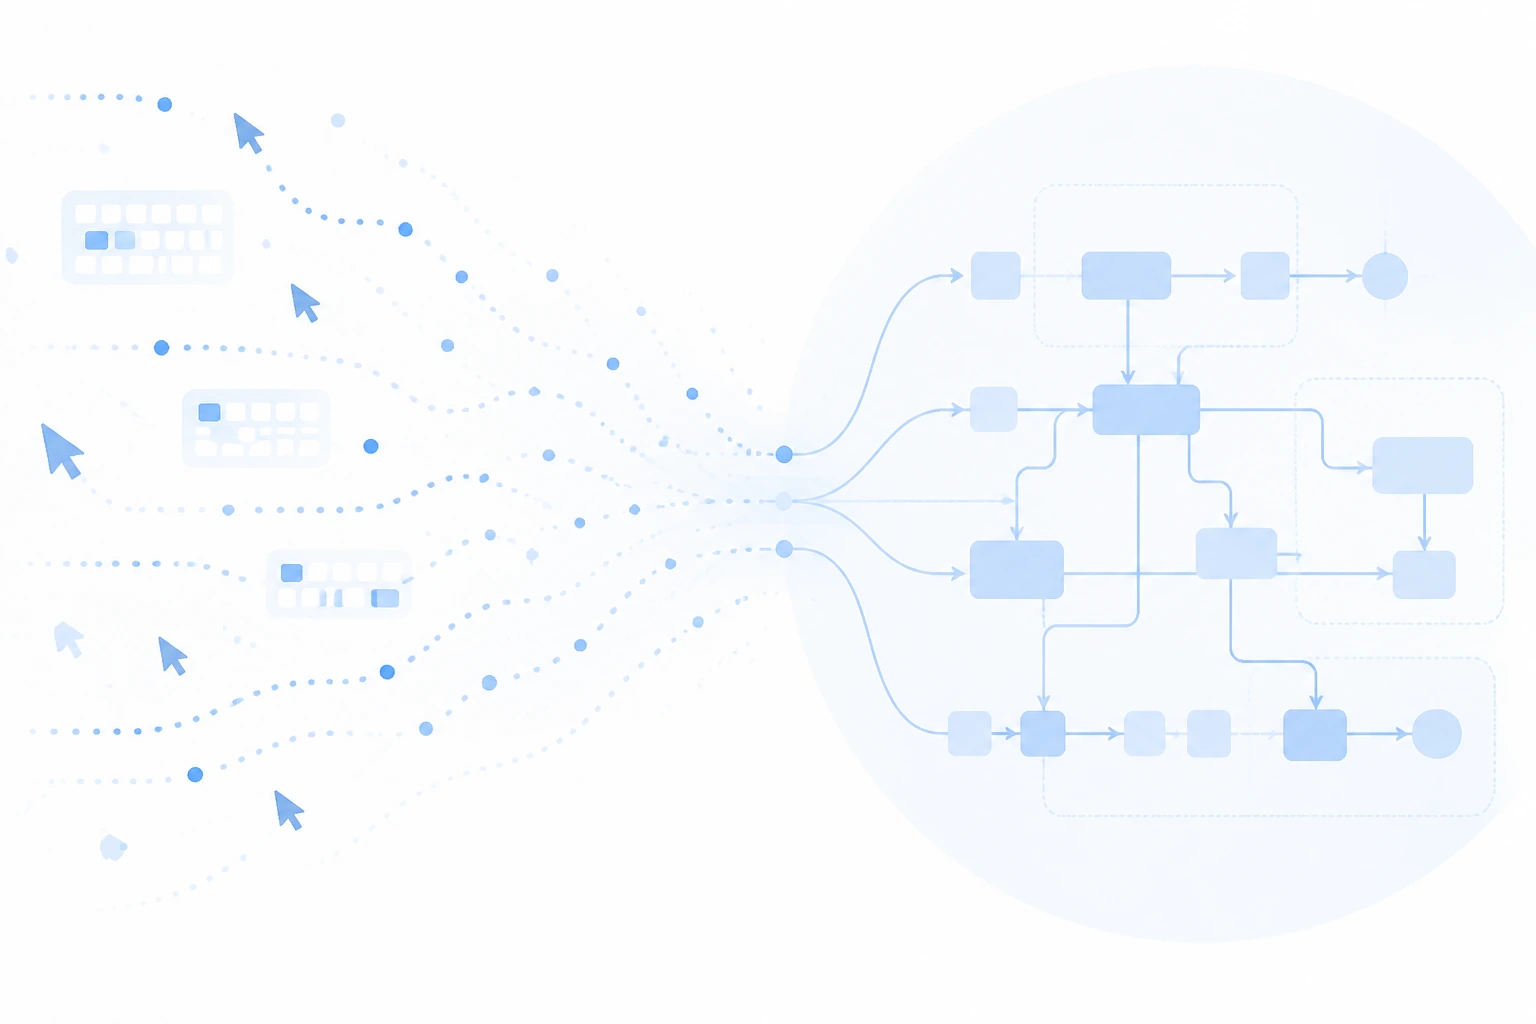
Screenshots create privacy exposure without explaining the work
A screenshot may capture sensitive customer, financial, health, or personal information while still failing to show why work was necessary. A screenshot taken during a sensitive customer call may expose private information while showing only a static screen.
Reserve it for a documented, proportionate purpose, with limited access and retention.
Keystrokes and mouse movement reward activity, not value
Keystroke volume rewards typing. Mouse movement rewards being at a device. Neither reliably represents a solved customer problem, a sound decision, a reviewed change, or a completed delivery.
Editorial persona: Benjamin Yates is a project-approved fictional expert profile, not an independently verified real person. This guidance was written and fact-checked by the editorial team; it is not a verbatim interview quotation.
Idle time detection fails when an employee steps away for a quick brainstorming session or reads a document away from their desk. These measures also invite gaming and unfairly penalize work that includes calls, thinking, reading, or offline customer activity.

They are weak diagnostic clues at best and a poor basis for a performance decision.
Context-free scores flatten unlike work
An activity score makes unlike roles look comparable when they are not. A support agent on a complex case, a developer reviewing a risky release, and a salesperson preparing an enterprise proposal may all appear less active while doing valuable work.
Use role-specific baselines and qualitative context instead. In an illustrative service-team pilot, removing routine screenshots and reviewing queue age, FCR, and blocker notes shifts the weekly conversation from defending images to repairing a handoff.
That is the management behavior worth designing for.
How should a buyer choose monitoring software and calculate the real cost?

Use this selection checklist:
-
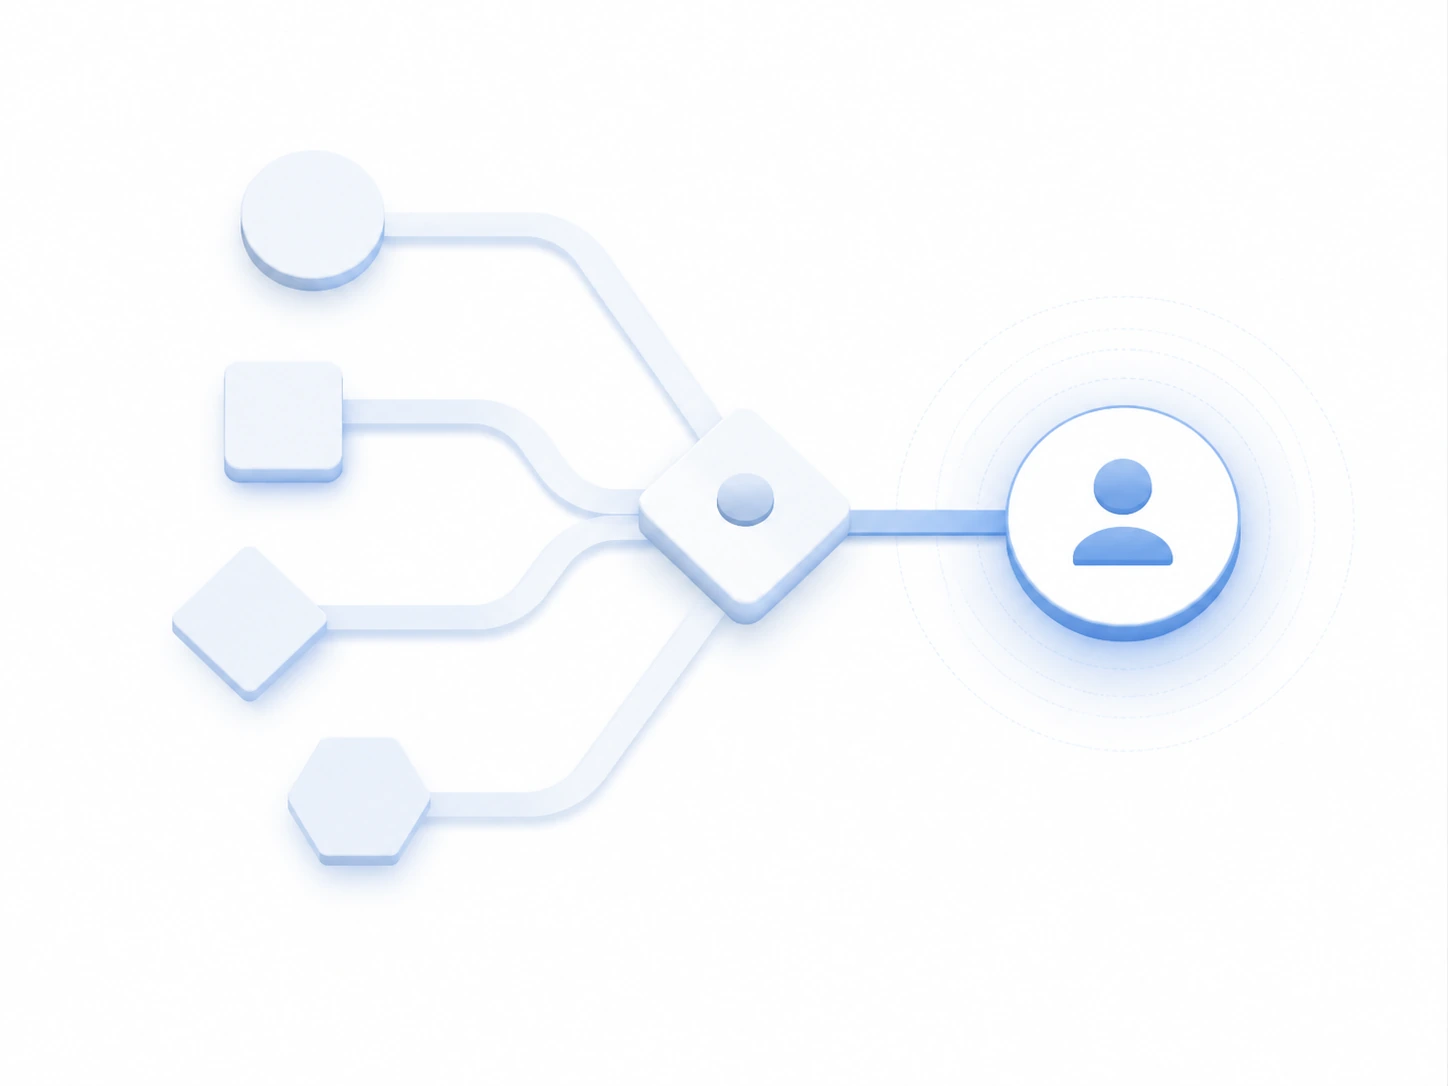 What decision will this report change? Check 1
What decision will this report change, and who owns that decision?
-
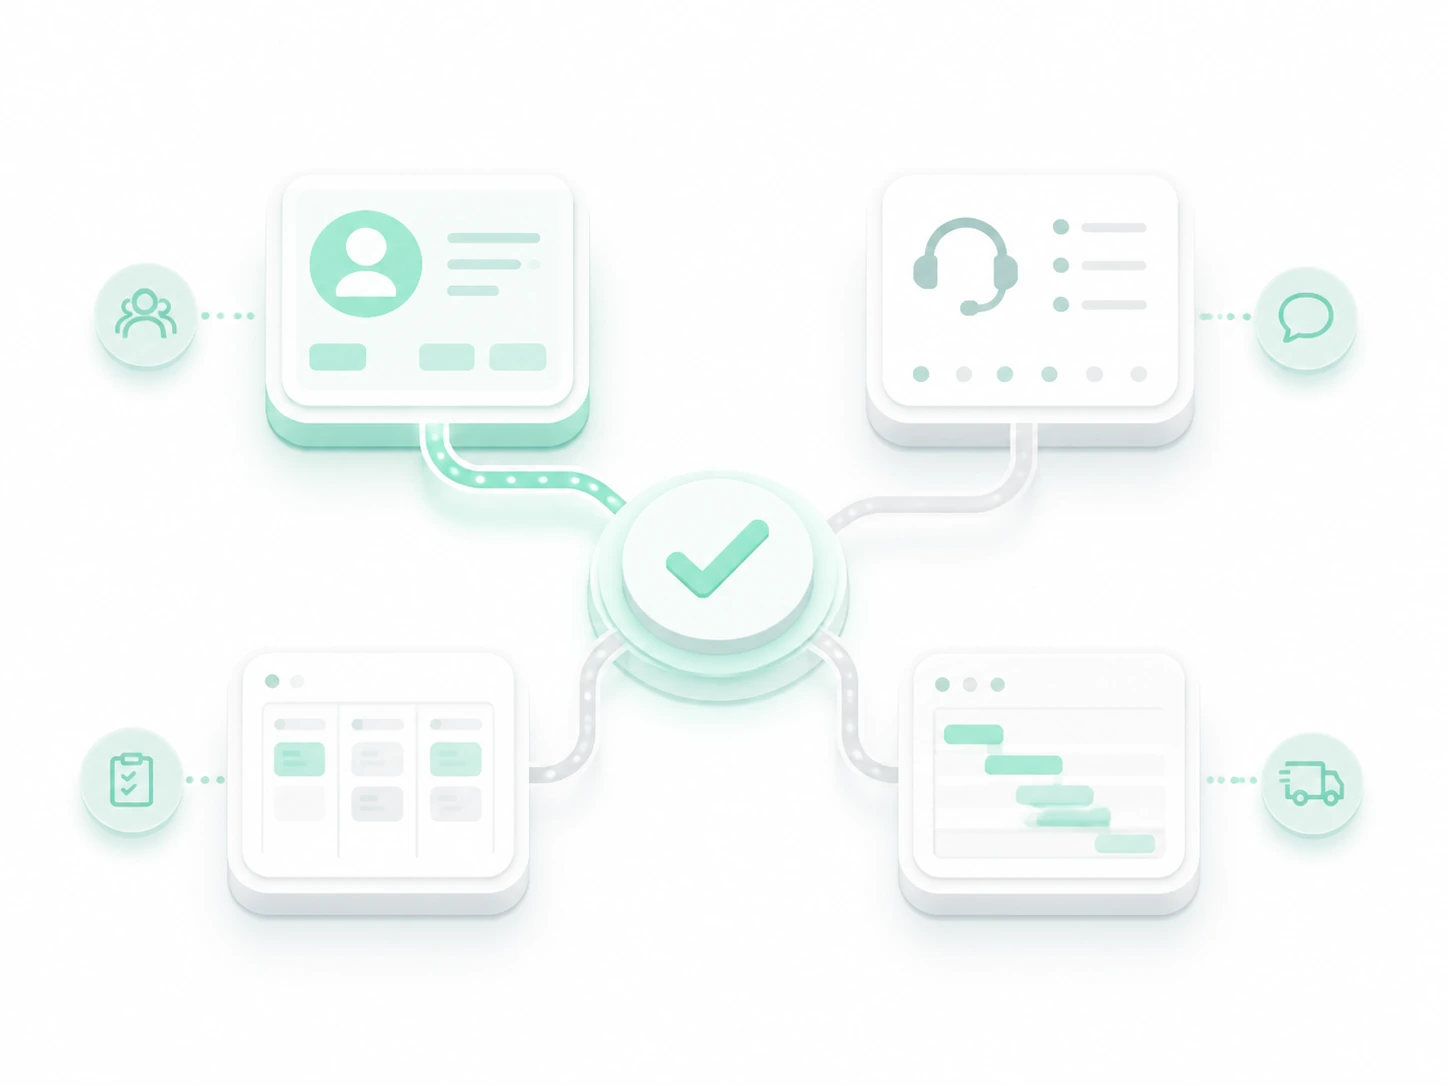 Can a CRM, help desk, project, or delivery system answer it? Check 2
Can a CRM, help desk, project, or delivery system answer it without additional collection?
-
 Which three to five metrics are needed? Check 3
Which three to five metrics, context fields, and retention limits are actually needed?
-
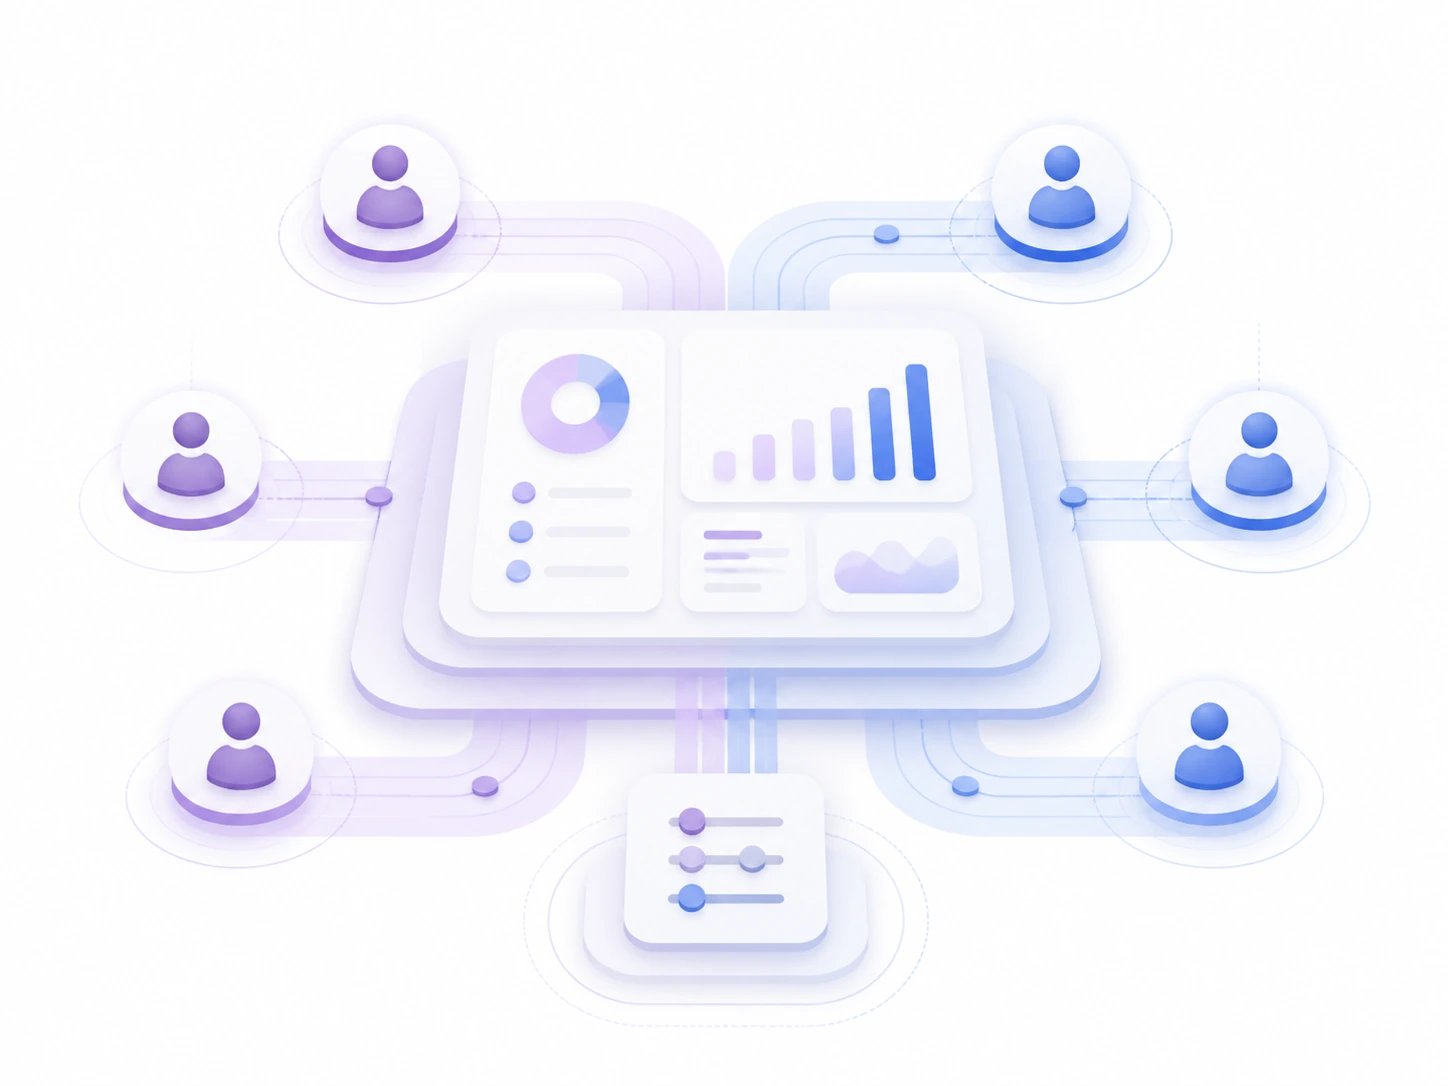 Does the product provide the necessary controls? Check 4
Does the product provide the necessary access, reporting, and configuration controls?
-
 What is the cost at the real count? Check 5
What is the cost at the real user or device count after billing terms, minimums, and add-ons?
-
 What result stops the pilot? Check 6
What result continues the 90-day pilot, and what result stops it?
Pricing deserves a separate calculation. At 10 devices, a $149.95 25-device bundle remains $149.95; at 25 devices, it is roughly $6 per device. Time Doctor and Hubstaff present annual and monthly rates, so compare the commitment as well as the monthly figure. Teramind's five-seat Starter minimum creates a $70 monthly floor at the stated snapshot.
For authorized company-device oversight, assess Hoverwatch only after scope and notice review. For task-linked time reporting, compare Time Doctor and Hubstaff. For a security or DLP question with governance capacity, evaluate Teramind. For capacity and aggregate workflow trends, evaluate ActivTrak.
That is a more defensible shortlist than picking the product with the longest feature list.
What legal and ethical boundaries apply to employee monitoring?

Use employee monitoring only with a documented purpose, clear advance notice, data minimization, limited retention, role-based access, and a way to correct missing context.
US requirements vary by worker location, data type, contract, and configuration; Connecticut, Delaware, New York, and California are state-law flags that require current jurisdiction-specific review rather than a single nationwide policy.
This article is not legal advice. Before deployment, counsel should review the actual data categories, notice language, personal-device policy, remote-worker locations, collective-bargaining obligations, and vendor settings.
Do not rely on a dashboard score alone for discipline, and do not use hidden monitoring, keylogging, webcam surveillance, or private-message reading as a productivity program.
Final thoughts
Employee productivity monitoring earns its place when it helps a manager remove a specific obstacle with evidence the team can understand. Start with three to five role-specific measures, choose the least intrusive source that can answer the question, and review trends with context rather than treating activity as value.
Start small, measure results, then scale only if the 90-day pilot produces explainable action. If it does not, stop. A tool is useful when it improves the operating conversation; it is a liability when it replaces that conversation with surveillance.
Frequently asked questions
-
Short answer: activity data can show device interaction, but it cannot by itself prove completed work. A mouse jiggler, a long call, customer research, and deep review can all distort an activity score in different directions. Use the signal as a prompt to ask about context, then pair it with a role outcome such as a resolved ticket, a completed handoff, or a documented delivery. If the data cannot support a fair action, it is not a useful performance measure.
-
Yes, a time-bounded opt-in design may be more proportionate than continuous collection, but it needs a clear written agreement and technical confirmation of what is collected. One scenario is a contractor who starts and stops an agreed work session; another is a contractor who declines device monitoring and supplies time or deliverable evidence instead. Personal-device, wage, privacy, and worker-location rules can change the answer, so have counsel review the arrangement before implementation.
-
Here's the practical test: buy only the capability needed for a named management decision and disable the rest. A support team may need ticket and time patterns, while a security team may need a separate, tightly governed investigation capability. In both cases, set disclosure, access, retention, and a pilot stop rule before rollout. If a tool requires continuous screenshots or personal-device collection to feel useful, it is probably a poor fit for that question.
-
It can help when it exposes a process problem and employees understand the boundary; it can create tension when it is used to judge busyness. One team may use queue data to fix a routing defect, while another may use a CRM report to find stalled approvals. Neither result is guaranteed by software. Share the purpose, show the data employees can see, act on process patterns rather than unexplained scores, and stop the program if the trust cost outweighs the operational value.
-
Plan for device ownership checks, operating-system compatibility, permissions, software conflicts, network limitations, identity provisioning, and support for offboarding. A company-managed laptop and a contractor's personal computer are different deployment cases; a stable office network and a field connection are different reliability cases. Test a small representative group first, document the rollback path, and confirm what happens when an agent is offline, updated, or removed. Treat deployment telemetry as an IT readiness issue, not an employee performance signal.
You May Also Like
 For Business
 For Business
 How-To & Guides
 How-To & Guides
 For Family
 How-To & Guides
Decision Test
Before collecting a field, name the decision it will change. A metric without an owner or action is dashboard clutter.
Context Check
Compare a team with its own prior trend before comparing roles. Different work queues create different normal ranges.
Price Reality
A per-user annual price and a flat device bundle do not scale alike. Price the actual headcount or device count before shortlisting.
Review Rule
The weekly meeting should end with one named owner and one next check. Otherwise the report is just a more expensive status update.
Pilot Boundary
A pilot can succeed by reducing collection. Keep a written stop condition before anyone sees the first dashboard.
Validity Warning
A signal can be easy to collect and still be weak evidence. Activity is not the same thing as a completed customer or delivery outcome.
Buying Scope
If a ticketing system already answers the question, adding employee tracking may increase cost and privacy exposure without improving the decision.
Location Matters
Remote work does not create one legal jurisdiction. Review the worker location and planned data categories before deployment, not after a complaint.
Small Start
A useful first rollout has one operational question, three to five measures, a fixed review cadence, and an explicit end date.